With the help of Norby's link tracking, you can quickly see what links are top performers and how your audience is responding to calls-to-actions on your page.
To reach the Links section of your Norby account, please follow these steps:
- From the Norby dashboard, select Links from the left-hand menu.
- Next, choose a link you'd live to review. After hovering over it, the following options will appear - Analytics, Share, and More.

- Since we want to assess this link's performance, let's select Analytics. We'll dive into everything we can do with Link Analytics in the next section.
Overview of Link Analytics
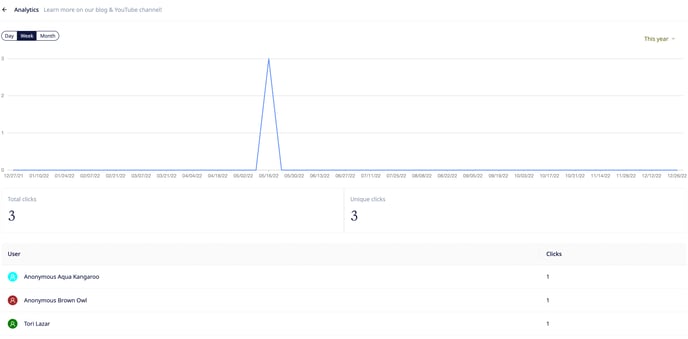
The link analytics enable you to review the following items on your page:
- Total Clicks
- Unique Clicks
- Breakdown of Clicks by User
The analytics will default to showing you the breakdown for Clicks over the time period of This year with the graph breakdown in Week increments. See below:

A couple of quick callouts on the available options for displaying the data:
- In addition to Week, the graph can also show clicks over Day and Month.
- In addition to This year the time-period can also be adjusted to the following:
- Custom, Today, Yesterday, This Week, This Month, and This Year.
User Clicks

Anyone who is in your Norby contact list will appear under the User column. In some instances, you will have Anonymous users show up in your link analytics data. Keep in mind that someone who visits and engages with your site becomes an Anonymous contact until they share their information with you via an action like registering for an event or signing up for your newsletter. In the example shown above that would apply to Anonymous Aqua Kangaroo and Anonymous Brown Owl. However since Tori Lazar has given us their contact information we see their name.
To learn more about Norby's Contacts feature, please review this help article.
