View the performance of your landing page by seeing who has viewed it, how they got there, and where they are located.
To reach the analytics section of your landing page, please follow these steps:
- From the Norby dashboard, select Landing Pages from the left-hand menu.
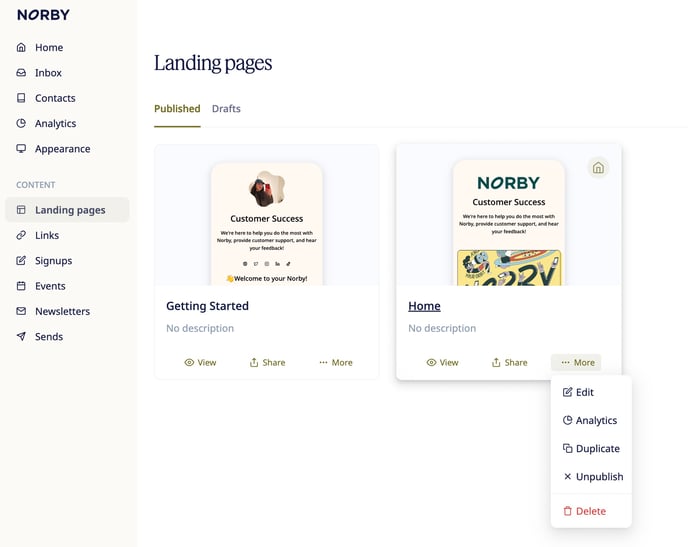
- Once on Landing Pages, hover over the page's analytics you would like to view. You will then see a list of these choices - Edit, Analytics, Duplicate, Unpublish, and Delete. Please review the example screenshot below for an example:

Overview of Analytics
The landing page analytics enable you to review the following items on your page:
- Visits
- Referrers
- Location
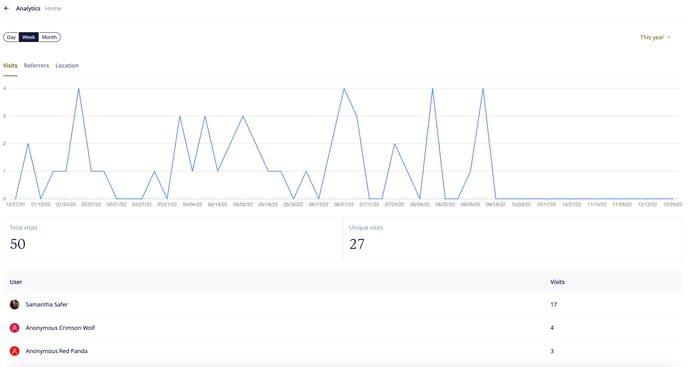
The analytics will default to showing you the breakdown for Visits over the time period of This year with the graph breakdown in Week increments. See below:

A couple of quick callouts on the options for displaying the data:
- In addition to Week, the graph can also show visits over Day and Month.
- In addition to This year the time-period can also be adjusted to the following:
- Custom, Today, Yesterday, This Week, This Month, and This Year.
- Custom, Today, Yesterday, This Week, This Month, and This Year.
User Visits
- Total visits = how many total times the page has been viewed. (Ex: 50)
- Unique visits = how many total visitors have viewed the page. (Ex: 27)
- You will be able to see who has viewed the page during the selected time-period.
- Anonymous contacts are those who have interacted with your page but are yet to identify themselves, such as registering for an event or signup. To learn more about contacts, please review this help article.
Referrers
Within the Referrers section, you can track how people are getting to your page by:
- URL
- Unique Referrals
- Total Referrals
**Note that unknown may appear under the URL section as sometimes Anonymous appears within Contacts.**

Location
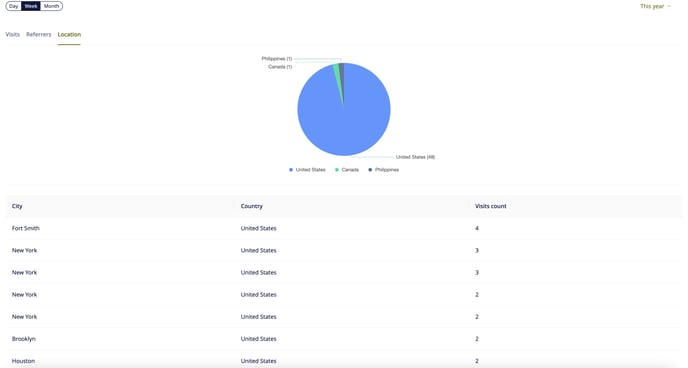
In the Location section, you will be able to track where your visitors are located. The view for for location is broken down by:
- City
- Country
- Visit Counts

